Instrument
The Instrument window is the central interface for chromatogram measurement and evaluation. To open it, select Login to Instrument from the Instruments submenu or click the corresponding icon in the main window. The instrument's name is set in the configuration settings (for more details see also chapter Right section of System Configuration dialog)
Clarity supports up to four Instrument windows displayed simultaneously. Each Instrument window has a unique header color for easy identification. The number of open Instrument windows can exceed the number of purchased instruments, but additional windows function only as Offline Instruments. These are commonly used for method development or evaluating previously measured analyses, but they cannot perform data acquisition.
The
| Icon | Name of Window | Description | |
|---|---|---|---|

|

|
Method Setup |
Open Method Setup dialog to create a new method or modify existing. |

|
Single Analysis | Open Single Analysis dialog to set specific parameters related to the measurement. | |

|
Sequence | Open Sequence window to prepare or measure multiple samples using sequence table. | |

|
Device Monitor | Open Device Monitor window to display parameters of directly controlled chromatograph and other controlled instrumentation. | |

|
Data Acquisition | Open Data Acquisition window to display signals from detectors. | |

|
Chromatogram | Open Chromatogram window to evaluate measured data. | |

|
Calibration | Open Calibration window to create a calibration which is then used for data evaluation. |
Click on any area of the image below to get relevant information
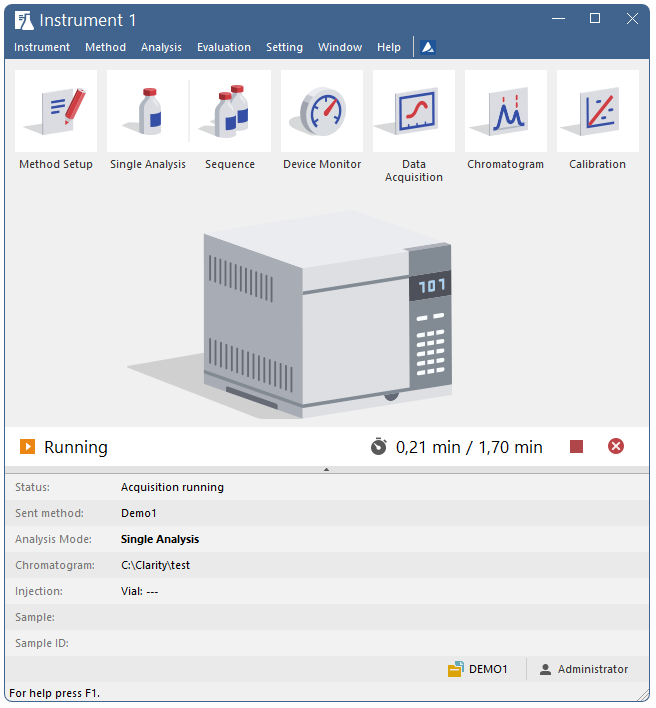
The Analysis Status bar, located below the workflow icons in the Instrument window, provides real-time information about the instrument's state, such as elapsed time during a running analysis or sequence and the current measurement status.


Analysis statuses
It also contains acquisition control buttons, which change dynamically based on the current operation:
-
 Send Method - Sends the method selected in the Single Analysis dialog to the connected hardware.
 -
 Run Sequence - Starts measuring the sequence opened in the Sequence window.
 -
 Stop Acquisition - Stops the ongoing acquisition.
 -
 Abort Acquisition - Immediately aborts the running acquisition.
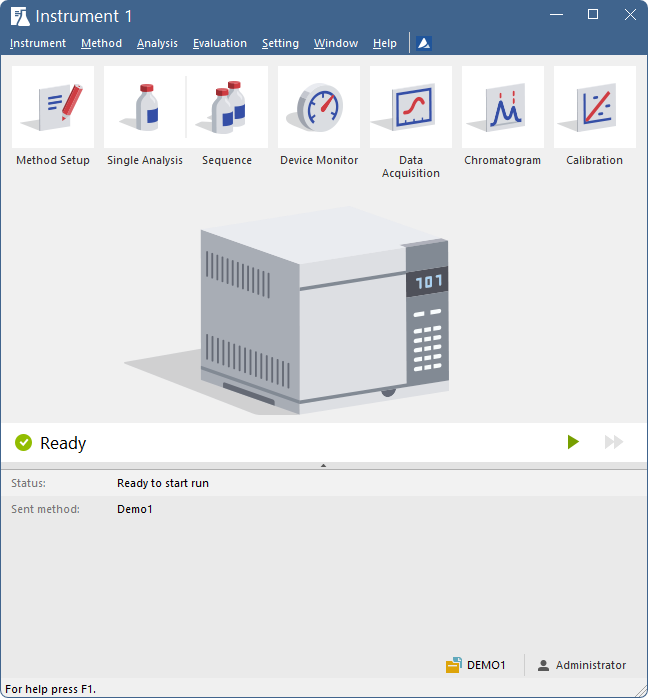
Below the status line is the Information Table, which provides details about the currently running analysis. When no analysis is running, only the Status and Sent Method fields are displayed, while the rest remain hidden. The table can be collapsed or expanded using the small arrow below the status line.
| Parameter | Description |
|---|---|
| Status | Displays complementary information to the status displayed above it. |
| Sent Method | Displays which method was sent to the instrument. If an analysis is running, this method is used for the current acquisition. If no analysis is running, this is the method that will be used when a Single Analysis starts. |
| Analysis Mode | Indicates whether Single Analysis or Sequence is running. If a sequence is running, it displays its name. |
| Chromatogram | Displays the name of the resulting chromatogram. |
| Injection | While a sequence is running, details about Row, Vial, and Injection are displayed. During Single Analysis, only Vial is shown if available. |
| Sample | Displays the content of the Sample field. |
| Sample ID | Displays the content of the Sample ID field. |
Instrument Ready
Project and user
The lower end of the
Tablet Mode
In Tablet Mode, the Instrument window cannot be fully maximized. Its width can be expanded up to a maximum of 50% of the monitor width.
When Tablet Mode is enabled and the general scale in Windows is set higher than 100%, some UI elements adjust to improve touch accessibility:
- Workflow icons are arranged into two rows for easier interaction.
- The analysis status line is divided into two rows to remain legible.
These adjustments ensure optimal usability when using Clarity on touchscreen devices.