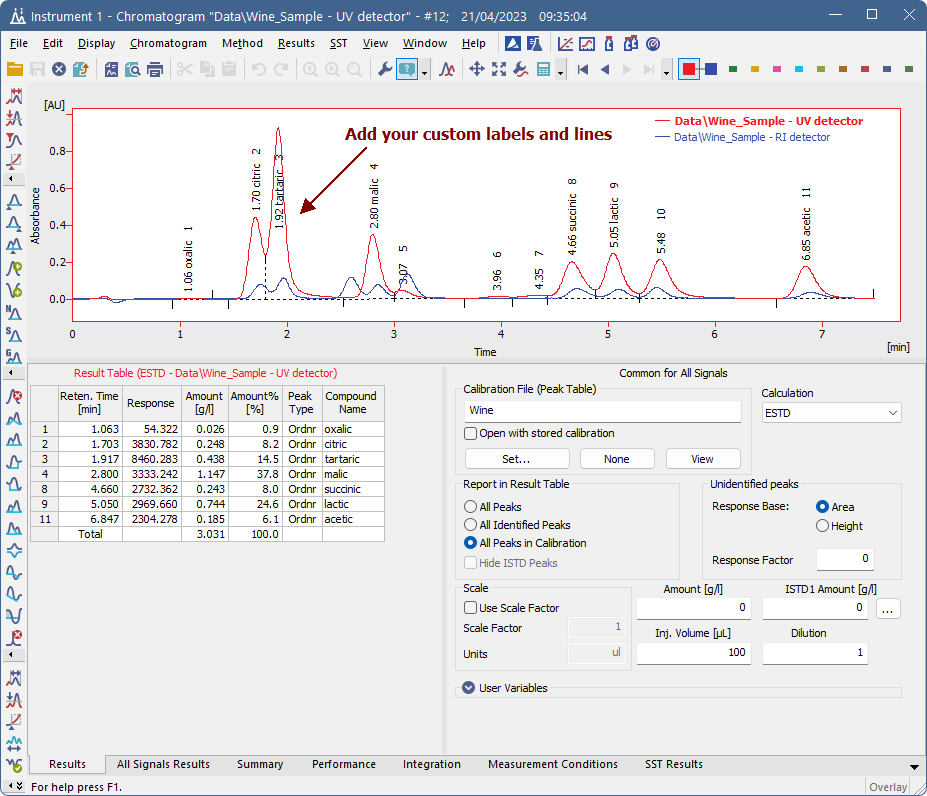
Chromatogram
This chapter serves as a crossroad for the Chromatogram window which is designed to display, adjust and evaluate chromatograms. It can be displayed using the Window - Chromatogram command or using the  icon from the
Window division
The window is divided into an upper panel with a graph and two lower panels with the results and the method calculation settings. Preview Graph panel can be displayed above the graph using Display - Preview Graph.
Lower part of the window displays number of tabs with different result tables and other parameters. The tabs enable the user to make adjustments to evaluation or display of the chromatogram.
Some tabs may not be visible following the station start-up, in which case the settings can be checked using the View - Show Tables command from the Chromatogram window menu.
List of possible tabs
| Type | Name of tab (or alternatives) |
|---|---|
| Default | Results |
| Default | All Signals Results |
| Default | Summary |
| Default | Performance |
| Default | Integration |
| Default | Measurement Conditions |
| SST Extension | SST Results |
|
Note: Extension appears only with purchased Extension license. |
|
Click on any area of the image below to get relevant information

Chromatogram
Note:
The text on the tabs and their number may vary depending on the way they have been set up and the Extensions you have installed.